
Lannett Announces Fiscal 2020 First-Quarter Financial Results

PHILADELPHIA, Nov. 6, 2019 /PRNewswire/ --
Financial and Business Highlights:
- Net Sales, Profitability Exceeded Expectations
- Launched First-to-Market Posaconazole
- Expanded Pipeline with Significant Future Opportunities:
• Levothyroxine (Approved)
• Generic ADVAIR DISKUS® - Successfully Completed $86.25 Million Convertible Notes Offering
![]()
Lannett Company, Inc. (NYSE: LCI) today reported financial results for its fiscal 2020 first quarter ended September 30, 2019.
"Our topline and bottom-line for the fiscal 2020 first quarter exceeded our expectations, largely due to strong sales of certain key products and the launch of Posaconazole late in the period," said Tim Crew, chief executive officer of Lannett. "We continue to build our business and expand our opportunities for ongoing growth. In the current quarter, we are now launching our third new product and plan to launch several more over the next several months. In addition, we secured exclusive U.S. commercialization rights to an approved ANDA for Levothyroxine Sodium Tablets, as well as an advanced development program for generic ADVAIR DISKUS®, a drug used to treat symptoms associated with asthma and other respiratory diseases. Both medications are potentially large market opportunities.
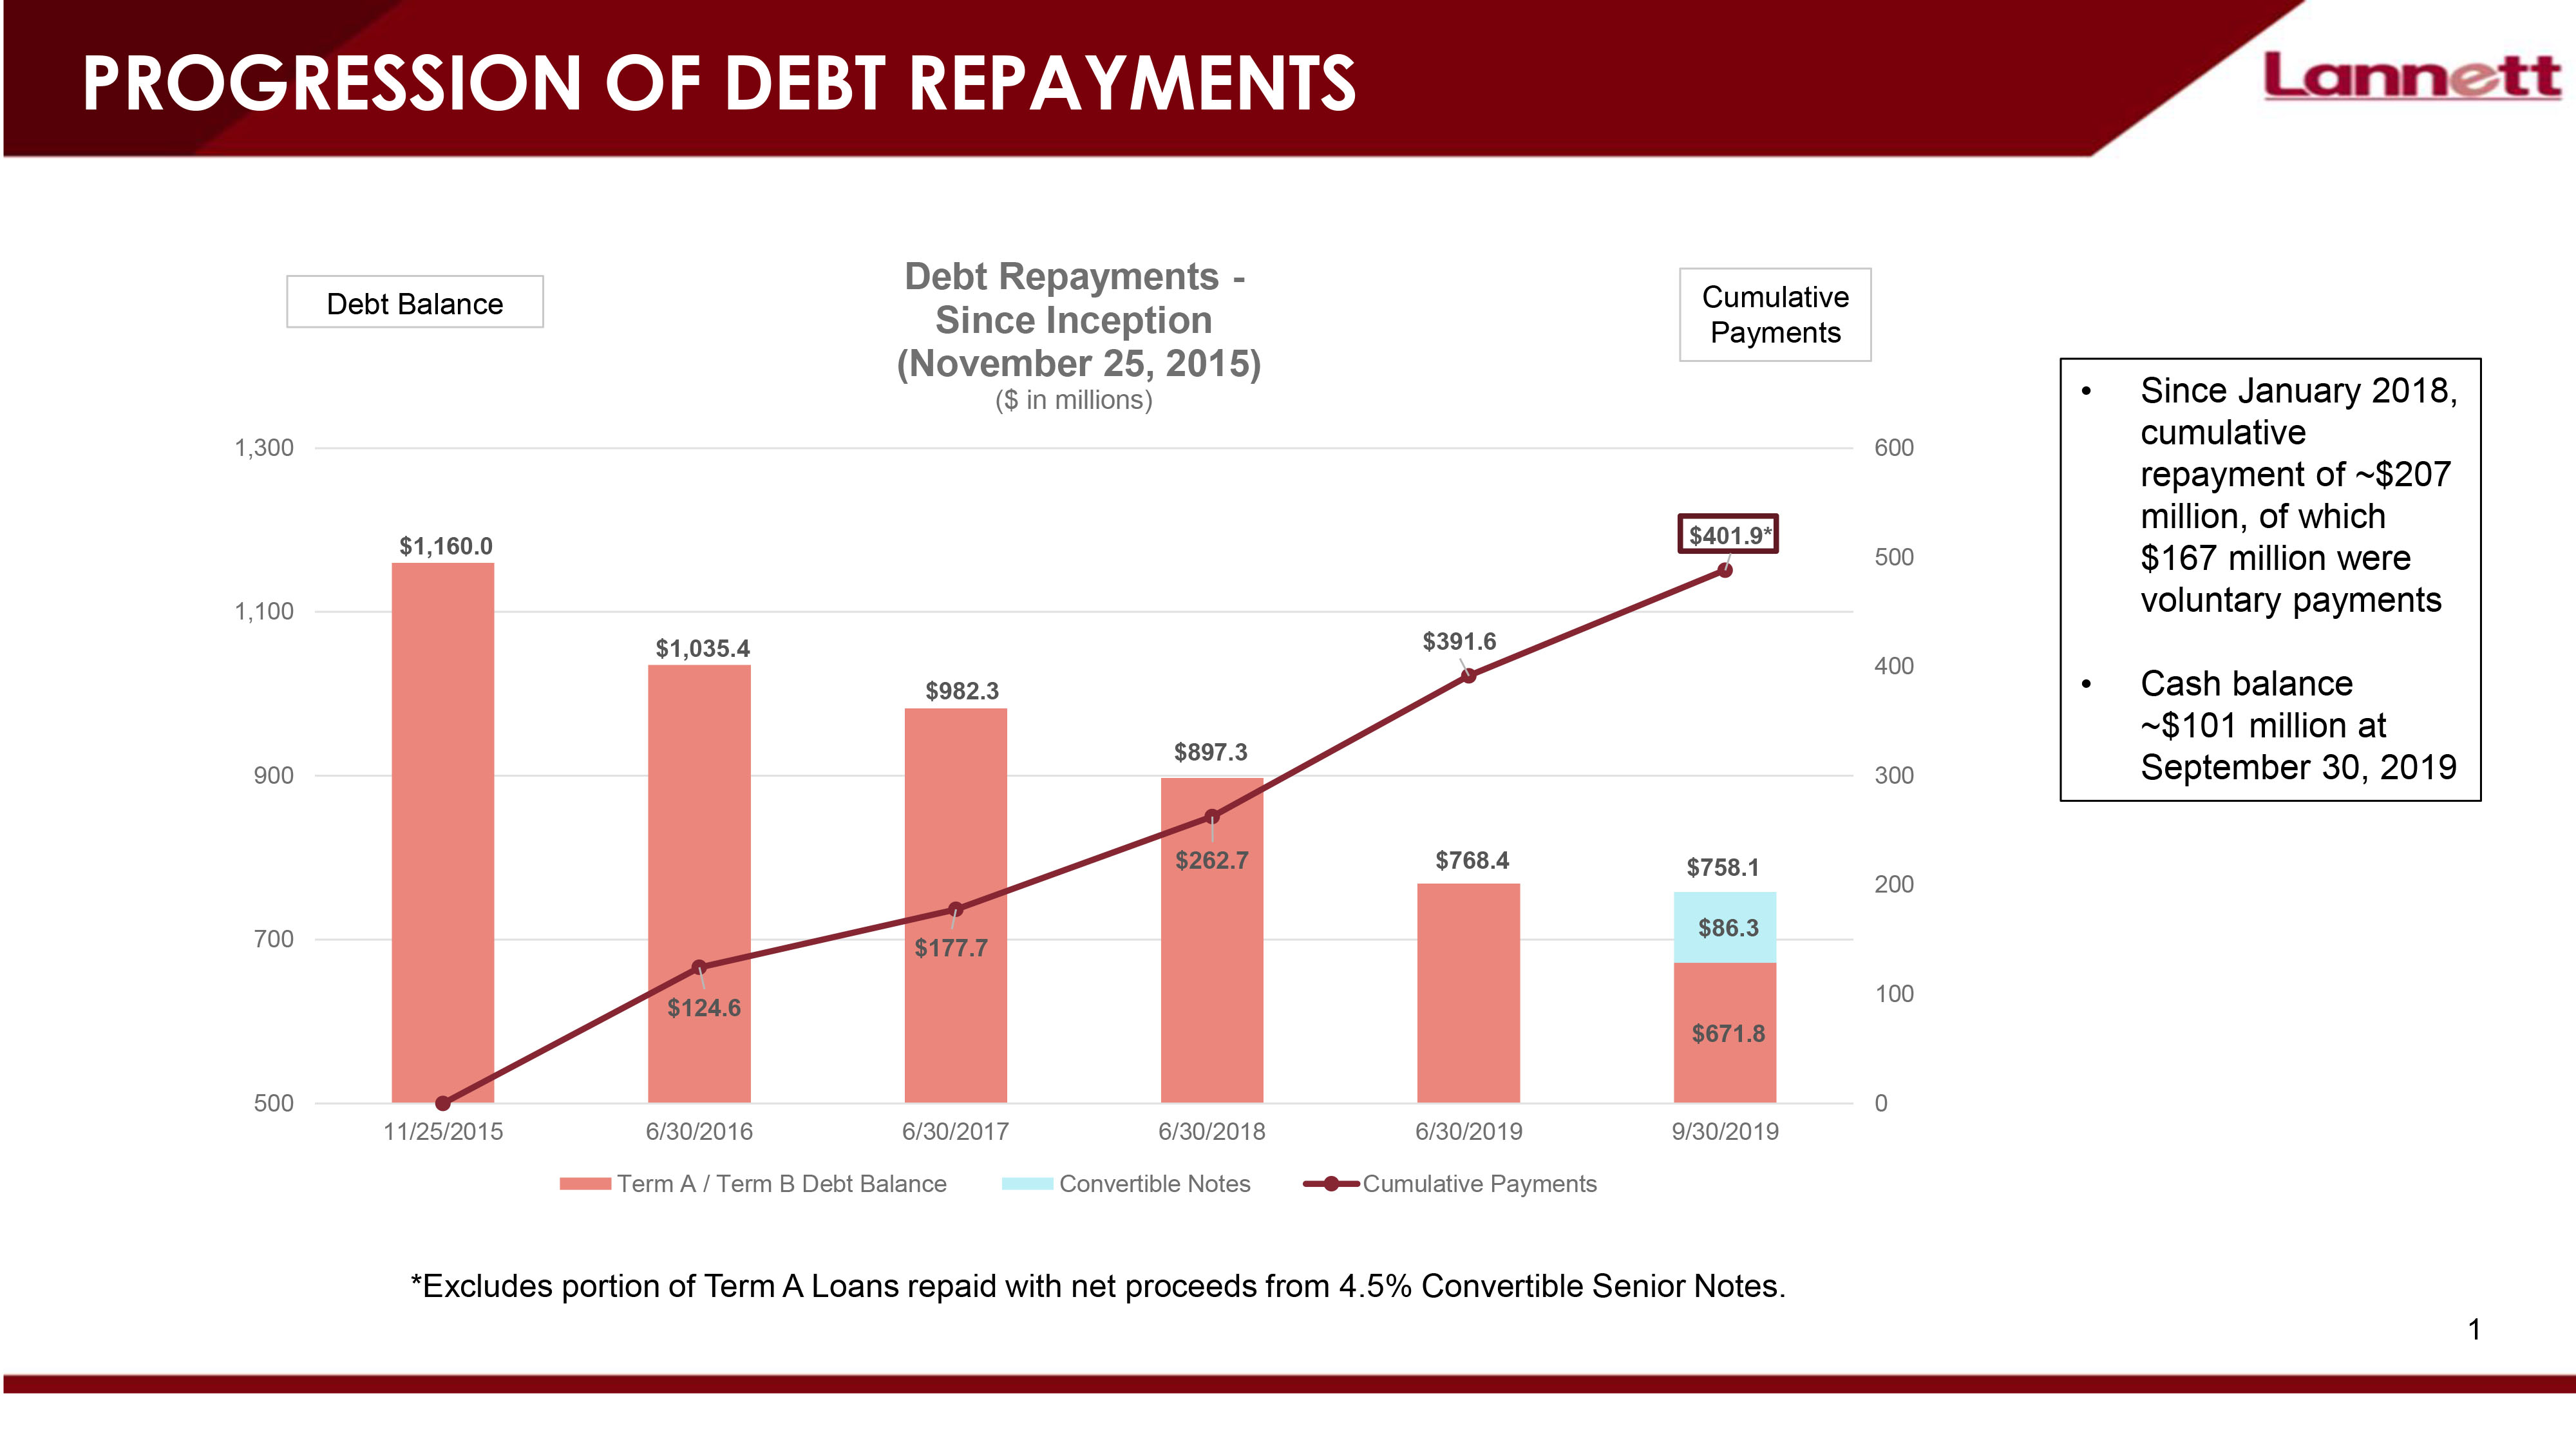
"Near the end of the first quarter, we completed an $86.25 million convertible notes offering, due 2026, and used the net proceeds to pay down half of our outstanding Term A Loans. Our existing cash position exceeds the remaining balance of the Term A Loans, which mature in about one year. As a result of the transaction, we lowered our interest expense, strengthened our balance sheet and improved our financial flexibility."
For the fiscal 2020 first quarter, on a GAAP basis, net sales were $127.3 million compared with $155.1 million for the first quarter of fiscal 2019. Gross profit was $42.7 million, or 33% of total net sales, compared with $59.1 million, or 38% of total net sales. Net loss was $12.2 million, or $0.32 per share. Net loss for the prior year first quarter, which included asset impairment charges of $369.5 million, was $287.5 million, or $7.65 per share.
For the fiscal 2020 first quarter reported on a Non-GAAP basis, net sales were $127.3 million compared with $155.1 million for the first quarter of fiscal 2019. Adjusted gross profit was $52.6 million, or 41% of adjusted net sales, compared with $68.7 million, or 44% of adjusted net sales, for the prior-year first quarter. Adjusted interest expense was $15.3 million compared with $16.9 million for the first quarter of fiscal 2019. Adjusted net income was $8.8 million, or $0.22 per diluted share, compared with $16.9 million, or $0.44 per diluted share, for the fiscal 2019 first quarter.
Guidance for Fiscal 2020
As discussed above, the company expects interest and other expense for fiscal 2020 to be lower than previously estimated as a result of the convertible notes offering. Based on its current outlook, the company revised certain items in its GAAP guidance and reiterated adjusted guidance for fiscal year 2020, except for interest and other. The full guidance is as follows:
|
GAAP |
Adjusted** |
|
|
Net sales |
$525 million to $545 million, unchanged |
$525 million to $545 million, unchanged |
|
Gross margin % |
Approximately 33.5% to 35.5%, unchanged |
Approximately 40% to 42%, unchanged |
|
R&D expense |
$34 million to $36 million, unchanged |
$34 million to $36 million, unchanged |
|
SG&A expense |
$69 million to $72 million, up from $68 million to $71 million |
$63 million to $66 million, unchanged |
|
Restructuring expense |
$2 million to $4 million, unchanged |
$ -- |
|
Asset impairment charges |
$2 million |
$ -- |
|
Interest and other |
$70 million to $72 million, down from $71 million to $73 million |
$54 million to $56 million, down from $56 million to $58 million |
|
Effective tax rate |
Approximately 16% to 17%, down from approximately 26% to 29% |
Approximately 22% to 23%, unchanged |
|
Adjusted EBITDA* |
N/A |
$145 million to $160 million, unchanged |
|
Capital expenditures |
$20 million to $25 million, unchanged |
$20 million to $25 million, unchanged |
|
**A reconciliation of Adjusted amounts to most directly comparable GAAP amounts can be found in the attached financial tables. |
Conference Call Information and Forward-Looking Statements
Later today, the company will host a conference call at 4:30 p.m. ET to review its results of operations for its fiscal 2020 first quarter ended September 30, 2019. The conference call will be available to interested parties by dialing 800-447-0521 from the U.S. or Canada, or 847-413-3238 from international locations, passcode 49151826. The call will be broadcast via the Internet at www.lannett.com. Listeners are encouraged to visit the website at least 10 minutes prior to the start of the scheduled presentation to register, download and install any necessary audio software. A playback of the call will be archived and accessible on the same website for at least three months.
Discussion during the conference call may include forward-looking statements regarding such topics as, but not limited to, the company's financial status and performance, regulatory and operational developments, and any comments the company may make about its future plans or prospects in response to questions from participants on the conference call.
Use of Non-GAAP Financial Measures
This news release contains references to Non-GAAP financial measures, including Adjusted EBITDA, which are financial measures that are not prepared in conformity with United States generally accepted accounting principles (U.S. GAAP). Management uses these measures internally for evaluating its operating performance. The Company's management believes that the presentation of Non-GAAP financial measures provides useful supplementary information regarding operational performance, because it enhances an investor's overall understanding of the financial results for the Company's core business. Additionally, it provides a basis for the comparison of the financial results for the Company's core business between current, past and future periods. The company also believes that including Adjusted EBITDA, as defined in the company's existing Credit Agreement, is appropriate to provide additional information to investors to demonstrate the company's ability to comply with financial debt covenants. Non-GAAP financial measures should be considered only as a supplement to, and not as a substitute for or as a superior measure to, financial measures prepared in accordance with U.S. GAAP.
Detailed reconciliations of non-GAAP financial measures to the most directly comparable GAAP financial measures are included with this release.
Non-GAAP financial measures exclude, among others, the effects of (1) amortization of purchased intangibles and other purchase accounting entries, (2) restructuring expenses, (3) non-cash interest expense, as well as (4) certain other items considered unusual or non-recurring in nature.
*Adjusted EBITDA excludes the same adjustments discussed above, as well as additional adjustments permitted under the company's existing Credit Agreement.
About Lannett Company, Inc.:
Lannett Company, founded in 1942, develops, manufactures, packages, markets and distributes generic pharmaceutical products for a wide range of medical indications – see financial schedule below for net sales by medical indication. For more information, visit the company's website at www.lannett.com.
This news release contains certain statements of a forward-looking nature relating to future events or future business performance. Any such statements, including, but not limited to, successfully commercializing recently launched products and planned product launches, and achieving the financial metrics stated in the company's guidance for fiscal 2020, whether expressed or implied, are subject to risks and uncertainties which can cause actual results to differ materially from those currently anticipated due to a number of factors which include, but are not limited to, the difficulty in predicting the timing or outcome of FDA or other regulatory approvals or actions, the ability to successfully commercialize products upon approval, including acquired products, and Lannett's estimated or anticipated future financial results, future inventory levels, future competition or pricing, future levels of operating expenses, product development efforts or performance, and other risk factors discussed in the company's Form 10-K and other documents filed with the Securities and Exchange Commission from time to time. These forward-looking statements represent the company's judgment as of the date of this news release. The company disclaims any intent or obligation to update these forward-looking statements.
|
Contact: |
Robert Jaffe |
|
Robert Jaffe Co., LLC |
|
|
(424) 288-4098 |
FINANCIAL SCHEDULES FOLLOW
|
LANNETT COMPANY, INC. |
|||
|
CONSOLIDATED BALANCE SHEETS |
|||
|
(In thousands, except share and per share data) |
|||
|
ASSETS |
|||
|
Current assets: |
September 30, 2019 |
June 30, 2019 |
|
|
Cash and cash equivalents |
$ 101,008 |
$ 140,249 |
|
|
Accounts receivable, net |
173,109 |
164,752 |
|
|
Inventories |
149,162 |
143,971 |
|
|
Prepaid income taxes |
159 |
- |
|
|
Assets held for sale |
4,637 |
9,671 |
|
|
Other current assets |
6,994 |
13,606 |
|
|
Total current assets |
435,069 |
472,249 |
|
|
Property, plant and equipment, net |
184,889 |
186,670 |
|
|
Intangible assets, net |
427,253 |
411,229 |
|
|
Goodwill |
- |
- |
|
|
Operating lease assets |
6,410 |
- |
|
|
Deferred tax assets |
110,396 |
109,305 |
|
|
Other assets |
7,914 |
7,960 |
|
|
TOTAL ASSETS |
$ 1,171,931 |
$ 1,187,413 |
|
|
LIABILITIES |
|||
|
Current liabilities: |
|||
|
Accounts payable |
$ 26,927 |
$ 13,493 |
|
|
Accrued expenses |
6,233 |
5,805 |
|
|
Accrued payroll and payroll-related expenses |
12,347 |
19,924 |
|
|
Rebates payable |
43,358 |
46,175 |
|
|
Royalties payable |
16,597 |
16,215 |
|
|
Restructuring liability |
1,167 |
2,315 |
|
|
Other current liabilties |
3,652 |
3,652 |
|
|
Income taxes payable |
- |
2,198 |
|
|
Short-term borrowings and current portion of long-term debt |
66,845 |
66,845 |
|
|
Current operating lease liabilities |
1,932 |
- |
|
|
Total current liabilities |
179,058 |
176,622 |
|
|
Long-term debt, net |
654,432 |
662,203 |
|
|
Long-term operating lease liabilities |
5,626 |
- |
|
|
Other liabilities |
14,711 |
14,547 |
|
|
TOTAL LIABILITIES |
853,827 |
853,372 |
|
|
STOCKHOLDERS' EQUITY |
|||
|
Common stock ($0.001 par value, 100,000,000 shares authorized; 39,629,271 and 38,969,518 shares issued; 38,526,558 and 38,010,714 shares outstanding at September 30, 2019 and June 30, 2019, respectively) |
40 |
39 |
|
|
Additional paid-in capital |
314,645 |
317,023 |
|
|
Retained earnings |
19,918 |
32,075 |
|
|
Accumulated other comprehensive loss |
(661) |
(615) |
|
|
Treasury stock(1,102,713 and 958,804 shares at September 30, 2019 and June 30, 2019, respectively) |
(15,838) |
(14,481) |
|
|
Total stockholders' equity |
318,104 |
334,041 |
|
|
TOTAL LIABILITIES AND STOCKHOLDERS' EQUITY |
$ 1,171,931 |
$ 1,187,413 |
|
|
LANNETT COMPANY, INC. |
|||
|
CONSOLIDATED STATEMENTS OF OPERATIONS |
|||
|
(In thousands, except share and per share data) |
|||
|
(UNAUDITED) |
|||
|
Three months ended |
|||
|
September 30, |
|||
|
2019 |
2018 |
||
|
Net sales |
$ 127,342 |
$ 155,054 |
|
|
Cost of sales |
77,656 |
87,690 |
|
|
Amortization of intangibles |
7,028 |
8,223 |
|
|
Gross profit |
42,658 |
59,141 |
|
|
Operating expenses: |
|||
|
Research and development expenses |
8,940 |
9,810 |
|
|
Selling, general, and administrative expenses |
21,308 |
20,588 |
|
|
Restructuring expenses |
1,388 |
1,022 |
|
|
Asset impairment charges |
1,618 |
369,499 |
|
|
Total operating expenses |
33,254 |
400,919 |
|
|
Operating income (loss) |
9,404 |
(341,778) |
|
|
Other income (loss): |
|||
|
Loss on extinguishment of debt |
(2,145) |
- |
|
|
Investment income |
729 |
379 |
|
|
Interest expense |
(19,292) |
(21,433) |
|
|
Other |
934 |
(296) |
|
|
Total other loss |
(19,774) |
(21,350) |
|
|
Loss before income tax |
(10,370) |
(363,128) |
|
|
Income tax expense (benefit) |
1,787 |
(75,600) |
|
|
Net Loss |
$ (12,157) |
$ (287,528) |
|
|
Loss per common share: |
|||
|
Basic |
$ (0.32) |
$ (7.65) |
|
|
Diluted |
$ (0.32) |
$ (7.65) |
|
|
Weighted average common shares outstanding: |
|||
|
Basic |
38,309,267 |
37,586,327 |
|
|
Diluted |
38,309,267 |
37,586,327 |
|
|
LANNETT COMPANY, INC. |
|||||||||||||||
|
RECONCILIATION OF GAAP REPORTED TO NON-GAAP ADJUSTED INFORMATION (UNAUDITED) |
|||||||||||||||
|
(In thousands, except percentages, share and per share data) |
|||||||||||||||
|
Three months ended September 30, 2019 |
|||||||||||||||
|
Net sales |
Cost of |
Amortization |
Gross |
Gross |
R&D |
SG&A |
Restructuring |
Asset |
Operating |
Other |
Income (loss) |
Income tax |
Net income |
Diluted |
|
|
GAAP Reported |
$ 127,342 |
$ 77,656 |
$ 7,028 |
$ 42,658 |
33% |
$ 8,940 |
$ 21,308 |
$ 1,388 |
1,618 |
$ 9,404 |
$(19,774) |
$ (10,370) |
$ 1,787 |
$(12,157) |
$ (0.32) |
|
Adjustments: |
|||||||||||||||
|
Amortization of intangibles (a) |
- |
- |
(7,028) |
7,028 |
- |
- |
- |
- |
7,028 |
- |
7,028 |
- |
7,028 |
||
|
Cody API business (b) |
- |
(1,722) |
- |
1,722 |
(420) |
(214) |
- |
- |
2,356 |
- |
2,356 |
- |
2,356 |
||
|
Depreciation on capitalized software costs (c) |
- |
- |
- |
- |
- |
(1,058) |
- |
- |
1,058 |
- |
1,058 |
- |
1,058 |
||
|
Decommissioning of Philadelphia sites (d) |
- |
(989) |
- |
989 |
- |
- |
- |
- |
989 |
- |
989 |
- |
989 |
||
|
Restructuring expenses (e) |
- |
- |
- |
- |
- |
- |
(1,388) |
- |
1,388 |
- |
1,388 |
- |
1,388 |
||
|
Asset impairment charges (f) |
- |
- |
- |
- |
- |
- |
- |
(1,618) |
1,618 |
- |
1,618 |
- |
1,618 |
||
|
Non-cash interest (g) |
- |
- |
- |
- |
- |
- |
- |
- |
- |
4,008 |
4,008 |
- |
4,008 |
||
|
Loss on extinguishment of debt (h) |
- |
- |
- |
- |
- |
- |
- |
- |
- |
2,145 |
2,145 |
- |
2,145 |
||
|
Other (i) |
- |
(208) |
- |
208 |
- |
(2,090) |
- |
- |
2,298 |
(966) |
1,332 |
- |
1,332 |
||
|
Tax adjustments (j) |
- |
- |
- |
- |
- |
- |
- |
- |
- |
- |
- |
999 |
(999) |
||
|
Non-GAAP Adjusted |
$ 127,342 |
$ 74,737 |
$ - |
$ 52,605 |
41% |
$ 8,520 |
$ 17,946 |
$ - |
$ - |
$ 26,139 |
$ (14,587) |
$ 11,552 |
$ 2,786 |
$ 8,766 |
$ 0.22 |
|
(a) |
To exclude amortization of purchased intangible assets primarily related to the acquisitions of KUPI and Silarx Pharmaceuticals, Inc. |
||||||||||||||
|
(b) |
To exclude the operating results of the ceased Cody API business |
||||||||||||||
|
(c) |
To exclude depreciation on previously capitalized software integration costs associated with the KUPI acquisition |
||||||||||||||
|
(d) |
To exclude the costs related to the decommissioning and shutdown of the Philadelphia manufacturing and distribution sites |
||||||||||||||
|
(e) |
To exclude expenses associated with the Cody API Restructuring Plan |
||||||||||||||
|
(f) |
To exclude impairment charges primarily associated with an operating lease right-of-use asset |
||||||||||||||
|
(g) |
To exclude non-cash interest expense associated with debt issuance costs |
||||||||||||||
|
(h) |
To exclude the loss on extinguishment of debt primarily related to the partial repayment of outstanding Term Loan A balance |
||||||||||||||
|
(i) |
To primarily exclude accrued separation costs related to the Company's former Chief Financial Officer as well as gains on sales of assets previously held for sale |
||||||||||||||
|
(j) |
To exclude the tax effect of the pre-tax adjustments included above at applicable tax rates |
||||||||||||||
|
(k) |
The weighted average share number for the three months ended September 30, 2019 is 38,309,267 for GAAP and 40,653,053 for the non-GAAP earnings (loss) per share calculations. As a result of the 4.5% Senior Convertible Note issued on September 27, 2019, the diluted earnings per share was calculated based on the "if-converted" method. |
||||||||||||||
|
LANNETT COMPANY, INC. |
|||||||||||||||
|
RECONCILIATION OF GAAP REPORTED TO NON-GAAP ADJUSTED INFORMATION (UNAUDITED) |
|||||||||||||||
|
(In thousands, except percentages, share and per share data) |
|||||||||||||||
|
Three months ended September 30, 2018 |
|||||||||||||||
|
Net sales |
Cost of |
Amortization |
Gross |
Gross |
R&D |
SG&A |
Restructuring |
Asset impairment |
Operating |
Other income |
Income (loss) |
Income tax |
Net income |
Diluted |
|
|
GAAP Reported |
$ 155,054 |
$ 87,690 |
$ 8,223 |
$ 59,141 |
38% |
$ 9,810 |
$ 20,588 |
$ 1,022 |
369,499 |
$(341,778) |
$(21,350) |
$ (363,128) |
$(75,600) |
$ (287,528) |
$ (7.65) |
|
Adjustments: |
|||||||||||||||
|
Depreciation of Fixed Assets step-up (a) |
- |
(1,335) |
- |
1,335 |
- |
- |
- |
- |
1,335 |
- |
1,335 |
- |
1,335 |
||
|
Amortization of intangibles (b) |
- |
- |
(8,223) |
8,223 |
- |
- |
- |
- |
8,223 |
- |
8,223 |
- |
8,223 |
||
|
Restructuring expenses (c) |
- |
- |
- |
- |
- |
- |
(1,022) |
- |
1,022 |
- |
1,022 |
- |
1,022 |
||
|
Asset impairment charges (d) |
- |
- |
- |
- |
- |
- |
- |
(369,499) |
369,499 |
369,499 |
- |
369,499 |
|||
|
Non-cash interest (e) |
- |
- |
- |
- |
- |
- |
- |
- |
- |
4,538 |
4,538 |
- |
4,538 |
||
|
Other (f) |
- |
- |
- |
- |
- |
(1,340) |
- |
- |
1,340 |
- |
1,340 |
- |
1,340 |
||
|
Tax adjustments (g) |
- |
- |
- |
- |
- |
- |
- |
- |
- |
- |
- |
81,504 |
(81,504) |
||
|
Non-GAAP Adjusted |
$ 155,054 |
$ 86,355 |
$ - |
$ 68,699 |
44% |
$ 9,810 |
$ 19,248 |
$ - |
$ - |
$ 39,641 |
$ (16,812) |
$ 22,829 |
$ 5,904 |
$ 16,925 |
$ 0.44 |
|
(a) |
Relates to depreciation of a fair value step-up in property, plant and equipment related to the acquisition of Kremers Urban Pharmaceuticals, Inc. ("KUPI") |
||||||||||||||
|
(b) |
Relates to amortization of purchased intangible assets primarily related to the acquisitions of KUPI and Silarx Pharmaceuticals, Inc. |
||||||||||||||
|
(c) |
To exclude expenses associated with the 2016 Restructuring Plan and, to a lesser extent, the Cody Restructuring Plan |
||||||||||||||
|
(d) |
To exclude asset impairment charges related to goodwill and other long-lived assets |
||||||||||||||
|
(e) |
To exclude non-cash interest expense associated with debt issuance costs |
||||||||||||||
|
(f) |
To primarily exclude depreciation on previously capitalized software integration costs associated with the KUPI acquisition |
||||||||||||||
|
(g) |
The tax effect of the pre-tax adjustments included at applicable tax rates |
||||||||||||||
|
(h) |
The weighted average share number for the three months ended September 30, 2018 is 37,586,327 for GAAP and 38,752,010 for the non-GAAP earnings (loss) per share calculations |
||||||||||||||
|
LANNETT COMPANY, INC. |
|
|
RECONCILIATION OF NET LOSS TO ADJUSTED EBITDA (UNAUDITED) |
|
|
($ in thousands) |
|
|
Three months ended |
|
|
September 30, 2019 |
|
|
Net loss |
$ (12,157) |
|
Interest expense |
19,292 |
|
Depreciation and amortization |
12,789 |
|
Income tax expense |
1,787 |
|
EBITDA |
21,711 |
|
Share-based compensation |
4,459 |
|
Inventory write-down |
3,510 |
|
Asset impairment charges |
1,618 |
|
Investment income |
(729) |
|
Loss on extinguishment of debt |
2,145 |
|
Other non-operating income |
(934) |
|
Restructuring expenses |
1,388 |
|
Restructuring payments |
(2,536) |
|
Cody API business (a) |
2,356 |
|
Decommissioning of Philadelphia sites (b) |
989 |
|
Other(c) |
1,091 |
|
Adjusted EBITDA (Non-GAAP) |
$ 35,068 |
|
(a) |
To exclude the operating results of the ceased Cody API business |
|
(b) |
To exclude the costs related to the decommissioning and shutdown of the Philadelphia manufacturing and distribution sites |
|
(c) |
To primarily exclude separation costs related to the Company's former Chief Financial Officer |
|
LANNETT COMPANY, INC. |
|||||
|
RECONCILIATION OF GAAP TO NON-GAAP ADJUSTED INFORMATION (UNAUDITED) |
|||||
|
($ in millions) |
|||||
|
Fiscal Year 2020 Guidance |
|||||
|
Non-GAAP |
|||||
|
GAAP |
Adjustments |
Adjusted |
|||
|
Net sales |
$525 - $545 |
- |
$525 - $545 |
||
|
Gross margin percentage |
approx. 33.5% to 35.5% |
(6.5%) |
(a) |
approx. 40% to 42% |
|
|
R&D expense |
$34 - $36 |
- |
$34 - $36 |
||
|
SG&A expense |
$69 - $72 |
($6) |
(b) |
$63 - $66 |
|
|
Restructuring expense |
$2 - $4 |
($2 - $4) |
(c) |
- |
|
|
Asset impairment charges |
$2 |
($2) |
(d) |
- |
|
|
Interest and other |
$70 - $72 |
($16) |
(e) |
$54 - $56 |
|
|
Effective tax rate |
approx. 16% to 17% |
6% |
(f) |
approx. 22% to 23% |
|
|
Adjusted EBITDA |
N/A |
N/A |
$145 - $160 |
||
|
Capital expenditures |
$20 - $25 |
- |
$20 - $25 |
||
|
(a) The adjustment primarily reflects amortization of purchased intangible assets related to the acquisition of Kremers Urban Pharmaceuticals, Inc. ("KUPI") |
|
(b) The adjustment primarily excludes depreciation on previously capitalized software integration costs associated with the KUPI acquisition |
|
(c) To exclude expenses associated with the Cody API Restructuring Plan |
|
(d) This adjustment primarily excludes an impairment charge associated with an operating lease right-of-use asset |
|
(e) The adjustment primarily reflects non-cash interest expense associated with debt issuance costs |
|
(f) The adjustment reflects the impact of tax credits and deductions relative to expected annual pre-tax income |
|
LANNETT COMPANY, INC. |
|||
|
RECONCILIATION OF NET INCOME (LOSS) TO ADJUSTED EBITDA (UNAUDITED) |
|||
|
($ in millions) |
|||
|
Fiscal Year 2020 Guidance |
|||
|
Low |
High |
||
|
Net income (loss) |
$ (1.0) |
$ 6.0 |
|
|
Interest expense |
70.0 |
72.0 |
|
|
Depreciation and amortization |
56.0 |
57.0 |
|
|
Income taxes |
- |
2.0 |
|
|
EBITDA |
125.0 |
137.0 |
|
|
Share-based compensation |
9.0 |
10.0 |
|
|
Inventory write-down |
7.0 |
8.0 |
|
|
Separation costs |
1.0 |
1.0 |
|
|
Cody API business |
2.0 |
2.0 |
|
|
Inpairment |
2.0 |
2.0 |
|
|
Restructuring expenses |
2.0 |
4.0 |
|
|
Restructuring payments |
(3.0) |
(4.0) |
|
|
Adjusted EBITDA (Non-GAAP) |
$ 145.0 |
$ 160.0 |
|
|
LANNETT COMPANY, INC. |
|||
|
NET SALES BY MEDICAL INDICATION |
|||
|
Three months ended |
|||
|
($ in thousands) |
September 30, |
||
|
Medical Indication |
2019 |
2018 |
|
|
Analgesic |
$ 1,884 |
$ 1,829 |
|
|
Anti-Psychosis |
28,034 |
10,889 |
|
|
Cardiovascular |
21,606 |
21,770 |
|
|
Central Nervous System |
19,257 |
14,286 |
|
|
Endocrinology |
- |
53,878 |
|
|
Gastrointestinal |
16,962 |
17,594 |
|
|
Infectious Disease |
11,895 |
4,480 |
|
|
Migraine |
9,143 |
9,737 |
|
|
Respiratory/Allergy/Cough/Cold |
2,707 |
3,584 |
|
|
Urinary |
435 |
1,541 |
|
|
Other |
9,861 |
10,805 |
|
|
Contract manufacturing revenue |
5,558 |
4,661 |
|
|
Net Sales |
$ 127,342 |
$ 155,054 |
|
SOURCE Lannett Company, Inc.
